Friday, August 3, 2018

Torrent Pharma hits 52-week high post Q1 nos; brokerages raise target price

Shares of Torrent Pharmaceuticals has touched 52-week high of Rs 1,651.50, rising 8.5 percent intraday Friday despite company's net profit declined in the quarter ended June 2018.

The company has reported 13.3 percent fall in its Q1FY19 net profit to Rs 163 crore versus Rs 188 crore in the same quarter last fiscal.

Meanwhile, revenue of the company rose 37 percent to Rs 1,872 crore versus Rs 1,362 crore.

The drug maker plans to launch 15 abbreviated new drug applications (ANDAs) in the US in FY19.

related news PVR rises 10% after it renews agreement with Bookmyshow, Paytm for 3 years D-Street Buzz: Midcap stocks gain led by CG Power; Dr Reddy's Labs jumps 2%, INOX Leisure zooms 10%

Torrent Pharma bought domestic formulation business of Unichem Laboratories for Rs 3,600 crore in December 2017 and US-based generic pharmaceuticals and OTC company Bio-Pharm in January this year for an undisclosed sum.

Brokerage: Nomura | Rating: Buy | Target: Rs 1,752

Nomura has maintained buy rating on Torrent Pharma and raised target to Rs 1,752 from Rs 1,689 per share.

The research house has increased FY19/20 earnings estimates by 19%/4% as it feels that the company have enough levers to drive strong earnings growth.

Its valuation at a discount to companies with larger EBITDA contribution from India, it added.

Brokerage: Credit Suisse | Rating: Outperform | Target: Rs 1,700

Credit Suisse has maintained outperform rating on Torrent Pharma with a target at Rs 1,700 per share.

According to broking house, Unichem turnaround faster than expected and company is targeting to achieve Unichem's cash breakeven by FY19-end.

Unichem portfolio has started growing at mid-high single digits, while it grew by 3% YoY and adjusted for GST, growth was 8-9% YoY, it said.

Brokerage: ICICI Securities | Rating: Buy | Target: Rs 1,740

ICICI Securities has maintained buy call on Torrent Pharma and raised target to Rs 1,740 from Rs 1,564 per share.

The acquisition of Unichem��s India business will help improve growth trajectory, said ICICI Securities.

It has revised revenue and PAT estimates upwards by 1-2% and 0-1% for FY19-20, it added.

At 10:01 hrs Torrent Pharmaceuticals was quoting at Rs 1,638.10, up Rs 115.40, or 7.58 percent on the BSE.

Posted by Rakesh Patil First Published on Aug 3, 2018 10:19 am

Thursday, August 2, 2018

ON Semiconductor Corp to Post FY2018 Earnings of $1.90 Per Share, B. Riley Forecasts (ON)

ON Semiconductor Corp (NASDAQ:ON) – Equities researchers at B. Riley lifted their FY2018 EPS estimates for ON Semiconductor in a note issued to investors on Monday, July 30th. B. Riley analyst C. Ellis now forecasts that the semiconductor company will post earnings per share of $1.90 for the year, up from their previous estimate of $1.80. B. Riley has a “Buy” rating and a $30.00 price target on the stock. B. Riley also issued estimates for ON Semiconductor’s Q4 2018 earnings at $0.52 EPS, Q1 2019 earnings at $0.46 EPS, Q2 2019 earnings at $0.52 EPS, Q3 2019 earnings at $0.58 EPS, Q4 2019 earnings at $0.55 EPS, FY2019 earnings at $2.12 EPS, Q1 2020 earnings at $0.53 EPS, Q2 2020 earnings at $0.60 EPS and FY2020 earnings at $2.37 EPS.

Get ON Semiconductor alerts:

ON Semiconductor (NASDAQ:ON) last posted its quarterly earnings data on Sunday, July 29th. The semiconductor company reported $0.46 EPS for the quarter, beating analysts’ consensus estimates of $0.45 by $0.01. The company had revenue of $1.46 billion for the quarter, compared to analyst estimates of $1.43 billion. ON Semiconductor had a net margin of 16.66% and a return on equity of 24.14%.

A number of other research firms have also commented on ON. Craig Hallum lifted their price objective on shares of ON Semiconductor from $28.00 to $31.00 and gave the company a “buy” rating in a research note on Tuesday, June 5th. BidaskClub lowered shares of ON Semiconductor from a “strong-buy” rating to a “buy” rating in a research note on Friday, June 8th. Nomura initiated coverage on shares of ON Semiconductor in a research note on Wednesday, July 18th. They set a “buy” rating and a $30.00 price target on the stock. Zacks Investment Research lowered shares of ON Semiconductor from a “buy” rating to a “hold” rating in a research note on Monday, April 9th. Finally, ValuEngine lowered shares of ON Semiconductor from a “buy” rating to a “hold” rating in a research note on Monday, July 2nd. Two investment analysts have rated the stock with a sell rating, eight have issued a hold rating, eleven have issued a buy rating and one has issued a strong buy rating to the company’s stock. The company presently has a consensus rating of “Buy” and an average target price of $25.82.

NASDAQ ON opened at $22.17 on Thursday. The company has a current ratio of 1.54, a quick ratio of 0.93 and a debt-to-equity ratio of 0.65. The firm has a market capitalization of $9.40 billion, a price-to-earnings ratio of 15.18, a price-to-earnings-growth ratio of 0.91 and a beta of 2.07. ON Semiconductor has a one year low of $14.60 and a one year high of $27.10.

In other ON Semiconductor news, EVP George H. Cave sold 15,000 shares of the company’s stock in a transaction dated Thursday, May 10th. The shares were sold at an average price of $23.51, for a total transaction of $352,650.00. The sale was disclosed in a document filed with the SEC, which is available through this hyperlink. Also, EVP William Hall sold 25,179 shares of the company’s stock in a transaction dated Tuesday, May 15th. The stock was sold at an average price of $23.65, for a total transaction of $595,483.35. Following the transaction, the executive vice president now owns 375,391 shares in the company, valued at $8,877,997.15. The disclosure for this sale can be found here. Over the last quarter, insiders have sold 127,929 shares of company stock worth $3,062,646. Company insiders own 1.60% of the company’s stock.

A number of institutional investors and hedge funds have recently modified their holdings of the business. Bank of Montreal Can purchased a new stake in shares of ON Semiconductor in the second quarter valued at about $216,682,000. LSV Asset Management lifted its holdings in shares of ON Semiconductor by 11.4% in the first quarter. LSV Asset Management now owns 8,085,228 shares of the semiconductor company’s stock valued at $197,764,000 after purchasing an additional 829,500 shares in the last quarter. Blue Harbour Group L.P. lifted its holdings in shares of ON Semiconductor by 114.4% in the first quarter. Blue Harbour Group L.P. now owns 5,508,908 shares of the semiconductor company’s stock valued at $134,748,000 after purchasing an additional 2,938,900 shares in the last quarter. TCW Group Inc. lifted its holdings in shares of ON Semiconductor by 2.9% in the second quarter. TCW Group Inc. now owns 5,109,154 shares of the semiconductor company’s stock valued at $113,602,000 after purchasing an additional 142,020 shares in the last quarter. Finally, Sumitomo Mitsui Asset Management Company LTD lifted its holdings in shares of ON Semiconductor by 0.5% in the second quarter. Sumitomo Mitsui Asset Management Company LTD now owns 4,914,735 shares of the semiconductor company’s stock valued at $109,279,000 after purchasing an additional 24,040 shares in the last quarter. Institutional investors own 90.87% of the company’s stock.

About ON Semiconductor

ON Semiconductor Corporation manufactures and sells semiconductor components for various electronic devices worldwide. It operates through three segments: Power Solutions Group, Analog Solutions Group, and Image Sensor Group. The Power Solutions Group segment offers discrete, module, and integrated semiconductor products for various applications, such as power switching, power conversion, signal conditioning, circuit protection, signal amplification, and voltage reference.

Further Reading: Trading Strategy Examples and Plans

Earnings History and Estimates for ON Semiconductor (NASDAQ:ON)

Wednesday, July 25, 2018

L.B. Foster (FSTR) Earns Daily Coverage Optimism Rating of 0.07

News articles about L.B. Foster (NASDAQ:FSTR) have trended somewhat positive recently, according to Accern Sentiment. The research firm identifies positive and negative press coverage by monitoring more than twenty million blog and news sources in real time. Accern ranks coverage of companies on a scale of negative one to positive one, with scores closest to one being the most favorable. L.B. Foster earned a media sentiment score of 0.07 on Accern’s scale. Accern also assigned news articles about the basic materials company an impact score of 41.2941599617828 out of 100, meaning that recent press coverage is somewhat unlikely to have an impact on the stock’s share price in the near future.

Separately, BidaskClub upgraded L.B. Foster from a “hold” rating to a “buy” rating in a research report on Friday, June 8th.

Get L.B. Foster alerts:

Shares of L.B. Foster traded down $0.05, hitting $22.35, on Friday, MarketBeat reports. 21,614 shares of the company’s stock traded hands, compared to its average volume of 42,786. L.B. Foster has a one year low of $17.00 and a one year high of $30.30. The company has a debt-to-equity ratio of 0.70, a current ratio of 2.02 and a quick ratio of 1.01. The firm has a market cap of $231.66 million, a price-to-earnings ratio of 25.40 and a beta of 2.28.

L.B. Foster (NASDAQ:FSTR) last announced its earnings results on Tuesday, May 1st. The basic materials company reported ($0.20) EPS for the quarter. L.B. Foster had a net margin of 0.84% and a return on equity of 6.49%. The business had revenue of $122.45 million for the quarter.

L.B. Foster Company Profile

L.B. Foster Company manufactures and distributes products and services for the transportation and energy infrastructure worldwide. Its Rail Products and Services segment offers new rail for passenger and shortline freight railroads, industrial companies, and rail contractors; used rail; rail accessories, such as track spikes, bolts, angle bars, and other products; power rail, direct fixation fasteners, coverboards, and special accessories; and trackwork products, as well as engineers and fabricates insulated rail joints and related accessories.

Featured Article: Understanding Relative Strength Index

Insider Buying and Selling by Quarter for L.B. Foster (NASDAQ:FSTR)

Saturday, July 21, 2018

IHOP: Fake name shift to 'IHOb' was success

Corrections & Clarifications: An earlier version of this story misstated Darren Rebelez's title.

IHOP�spoon-fed the world a short explanation for why it�underwent a fake name change last month, when it briefly called�itself IHOb.

��We take our burgers as seriously as our pancakes,�� it said, explaining why it substituted�a�"b" for burgers for the "P" for pancakes in its name.

But while its president has no doubts, the company has�yet to disclose whether its gambit, which promoted its lunch and dinner business, enhanced its bottom line.

Five weeks after the promotion, IHOP President Darren Rebelez was candid about the reasons behind�the shift in an interview.

The company�has not been as popular with the�lunch and dinner crowds, even though it's�open 24/7. No surprise there: IHOP�is a shortened version of the original name, the International House of Pancakes.

��We just didn��t put the focus on�� lunch and dinner ��that�we needed to,���Rebelez said.�

More than half of IHOP��s sales totals come�from breakfast, analysts say. For sales from dinner, that number is 16 percent.�

To remedy this, IHOP decided to "go fish where the fish are,�� Rebelez said. And the rest was history. From a tweet flipping the "P" with a "b" on June 4 to officially shifting to�IHOb the following week,�IHOP launched its burger offensive.

Burgers are the most-ordered entr茅e in restaurants nationwide, according to the food chain��s president, and IHOP opportunistically hopped onto the meaty item��s popularity wave.

This marketing campaign is neither IHOP��s first time selling burgers nor its first attempt at shifting consumers�� focus to dinner items. The company has sold hamburgers since its conception 60 years ago, and it has previously tried promotions and menu switches to cater to a nonbreakfast crowd, according to Raymond James analyst Brian Vaccaro.

Past marketing campaigns did not generate the same level of buzz, though. Rebelez said that for IHOP to successfully double down on lunch and dinner audiences, it needed to get people to think of IHOP as a ��player in the burger business.��

IHOP��s efforts did not go unnoticed. The social media campaign received more than 30 billion media impressions and was the topic of 20,000 news stories, according to Rebelez.

And, according to YouGov, which tracks the perception of more than 1,500 brands daily through its BrandIndex, IHOP��s Word of Mouth score rose from 19 percent�to 30 percent in the week following its announcement.

With IHOP's latest earnings still unreported, the jury is�out on whether�the marketing blitz will bring financial gain.

Analysts had varying speculations on the success of the�campaign.

Stephen Anderson, an analyst for the Maxim Group, said�IHOP has made itself a topic of conversation more effectively than ever before �� a move which he thinks will bear fruit for the company's sales of nonbreakfast items.

Some companies have succeeded�in the following quarter after experimenting with a name change to highlight a different menu item, according to Anderson. Pizza Hut temporarily transformed into Pasta Hut nearly a decade ago in the United Kingdom. In the following 12 months after they used that name, Anderson said sales increased more than 1 percent.

Anderson also noted that IHOP��s emphasis on burgers coincides nicely with the recent launch of its national delivery service, as burgers ��tend to travel well.��

Dan Hill, CEO of Hill Impact, said he is�unsure if the move would result in increased sales. However, he thinks�it is ��misplaced�� to assume increased conversation will result in a greater windfall for IHOP.

Regardless of the economic result, Hill said he disliked the campaign due to how it misled customers and stakeholders alike into believing the company was changing its name. IHOP told USA TODAY that the name change was temporary before the launch on June 11.

��Any marketing ploy that is based on dishonesty says something about your culture,�� Hill said. ��It says you care more about sales than you do integrity.��

Though Rebelez declined to comment on IHOP��s sale of burgers and total earnings, he hinted that the company��s new burger line has been a success.

��If you��re going to grow your business, you have to take it from somebody else,�� he said. ��Somebody else out there lost a burger sale.��

Follow USA TODAY intern Ben Tobin on Twitter: @TobinBen

CLOSE

IHOP is making one unexpected move after another! Now the chain has announced plans to begin a delivery service. Buzz60's Maria Mercedes Galuppo has more. Buzz60

Thursday, July 19, 2018

Buy DCB Bank; target of Rs 240: JM Financial


JM Financial's research report on DCB Bank


DCB Bank reported PAT of INR 695mn in 1QFY19, a tad below our estimates (4% below JMFe). The miss in PAT was largely driven by continued increase in opex (+17.5% YoY) as the moderation in topline growth (+17% YoY) was in-line with our estimates. DCBB witnessed compression in margin (26 bps QoQ) to 3.9% in 1QFY19, while balance sheet growth was strong (both loans and deposits were up 31% YoY). While competitive forces have resulted in headwinds for DCBB��s yields, we remain constructive on DCBB��s potential to improve its RoA, primarily driven by an improvement in its cost profile. We believe current levels provide an attractive entry point for the stock. We factor in the compression in NIM and cut our estimates by 2%/ 4% for FY19E and FY20E.


Outlook


We value DCBB at INR 240/sh (from INR 250/sh earlier), in line with the change in our earnings estimates. Maintain BUY.


For all recommendations report, click here


Disclaimer: The views and investment tips expressed by investment experts/broking houses/rating agencies on moneycontrol.com are their own, and not that of the website or its management. Moneycontrol.com advises users to check with certified experts before taking any investment decisions.

Read More First Published on Jul 18, 2018 05:19 pm

Thursday, July 12, 2018

Top 5 China Stocks To Watch Right Now

tags:BIDU,TISA,SINA,NTES,SOL,

Pre-open movers

U.S. stock futures traded higher in early pre-market trade. St. Louis Fed President James Bullard will speak at 9:40 a.m. ET.

Futures for the Dow Jones Industrial Average rose 67 points to 24,890.00, while the Standard & Poor’s 500 index futures rose 4.60 points to 2,734.00. Futures for the Nasdaq 100 index gained 17 points to 6,977.00.

Oil prices traded mixed as Brent crude futures rose 0.05 percent to trade at $77.16 per barrel, while US WTI crude futures fell 0.11 percent to trade at $70.62 a barrel.


A Peek Into Global Markets

European markets were lower today, with the Spanish Ibex Index falling 0.28 percent, STOXX Europe 600 Index declining 0.31 percent and German DAX 30 index dropping 0.43 percent. The UK's FTSE index was trading lower by 0.19 percent, while French CAC 40 Index fell 0.29 percent.

In Asian markets, Japan’s Nikkei Stock Average rose 0.47 percent, Hong Kong’s Hang Seng Index rose 1.35 percent, China’s Shanghai Composite Index gained 0.34 percent and India’s BSE Sensex rose 0.06 percent.

Broker Recommendation

Analysts at Deutsche Bank downgraded Dean Foods Company (NYSE: DF) from Hold to Sell.

Top 5 China Stocks To Watch Right Now: Baidu Inc.(BIDU)

Advisors' Opinion:
  • [By Stephan Byrd]

    Get a free copy of the Zacks research report on Baidu (BIDU)

    For more information about research offerings from Zacks Investment Research, visit Zacks.com

  • [By Rick Munarriz]

    Getting back to basics is a good look for Baidu's (NASDAQ:BIDU) financial statements. China's leading search engine came through with its best top-line growth since 2015 for this year's first quarter. Revenue topped the high end of its earlier guidance -- as it did last time out -- with earnings growing even faster.

  • [By Leo Sun]

    Shares of Baidu (NASDAQ:BIDU) recently rallied after the Chinese tech giant posted an impressive first quarter. Its revenue rose�31% annually to 20.9 billion RMB ($3.33 billion), topping estimates by $140 million and marking the company's strongest growth since the fourth quarter of 2015.

  • [By Danny Vena, Dan Caplinger, and Demitrios Kalogeropoulos]

    With that in mind, we asked three Fool.com contributors to highlight companies they believed could still be worthwhile holdings in the year 2038. Read on to find out why they chose Shopify (NYSE:SHOP), Baidu (NASDAQ:BIDU), and Costco Wholesale�(NASDAQ:COST).

  • [By Rick Munarriz]

    The naysayers are growing when it comes to�Baidu�(NASDAQ:BIDU). There were 5.3 million shares of China's undisputed search engine leader sold short as of mid-May. We're a far cry from the 7.2 million shares that were shorted a year ago, but 5.3 million is still a large enough number to stand as the highest short interest at Baidu since mid-October of last year.

  • [By Garrett Baldwin]

    Shares of Apple Inc. (Nasdaq: AAPL) may face additional pressure today after another surprise update from one of its biggest suppliers. Austria-based supplier AMS, a maker of optical sensors for the iPhone X, warned that sales for the second quarter will fall by roughly 50% from the first quarter. This comes not long after Taiwan Semiconductor Manufacturing Co. Ltd.�(ADR) (NYSE: TSM) offered a lower-than-expected Q2 revenue forecast. Now, Wall Street analysts could soon follow with cuts to iPhone sales forecasts, especially after rival Samsung warned of a slowdown in display panel sales. This morning, the European Central Bank announced it will maintain its record-low interest rates and accommodating monetary policy. At a time when the U.S. central bank is raising rates, the ECB failed to provide a timeline on when it will end its massive stimulus package, which features monthly bond purchases of $37 billion. Four Stocks to Watch Today: DNKN, QSR, GM, FB Hedge fund manager and notable short-seller Jim Chanos is lining up positions against two of the restaurant industry's best-known firms. Shares of Dunkin Brands Group Inc.�(Nasdaq: DNKN) and Restaurant Brands International Inc. (NYSE: QSR), which owns Burger King, were both sliding after Chanos said he was short the firms over sales concerns. The news comes the same morning that DNKN topped Wall Street profit estimates of $0.62 by $0.11. However, DNKN quarterly revenue fell short of expectations. Facebook Inc. (Nasdaq: FB) stock doesn't appear to be facing any significant fallout due to its ongoing data scandal. The social media giant shattered revenue expectations after the bell Wednesday. Shares popped 7% after the company reported a 50% year-over-year revenue surge. The firm reported 1.45 billion daily active users and 2.2 billion monthly users. This was the first earnings report since the Cambridge Analytica scandal that happened in March. Shares are rebounding, as the firm had lost billions in

Top 5 China Stocks To Watch Right Now: Top Image Systems Ltd.(TISA)

Advisors' Opinion:
  • [By Ethan Ryder]

    Get a free copy of the Zacks research report on Top Image Systems (TISA)

    For more information about research offerings from Zacks Investment Research, visit Zacks.com

Top 5 China Stocks To Watch Right Now: Sina Corporation(SINA)

Advisors' Opinion:
  • [By Shane Hupp]

    SINA Corp (NASDAQ:SINA) shares hit a new 52-week low on Wednesday . The stock traded as low as $83.39 and last traded at $82.78, with a volume of 41597 shares trading hands. The stock had previously closed at $85.15.

  • [By Steve Symington]

    Shares of SINA Corp. (NASDAQ:SINA) were down 10.2% as of 3:30 p.m. EDT Wednesday despite strong first-quarter 2018 results from the Chinese internet media company.

  • [By Leo Sun]

    But as the U.S. market remains stuck in neutral, Chinese tech stocks have thrived, sparked by impressive growth figures and their detachment from U.S.-centered issues. Let's examine three stocks in that industry which have already rallied more than 30% this month -- Baozun (NASDAQ:BZUN), Weibo (NASDAQ:WB), and SINA (NASDAQ:SINA).

  • [By Jack Delaney]

    SINA Corp. (Nasdaq: SINA) operates Weibo Corp. (Nasdaq: WB), a social media platform with 411 million monthly active users (MAUs) as of Q1 2018.

    It's considered the Twitter Inc. (NYSE: TWTR) of China.

  • [By Lisa Levin] Companies Reporting Before The Bell Anheuser-Busch InBev SA/NV (NYSE: BUD) is estimated to report quarterly earnings at $0.89 per share on revenue of $13.06 billion. SINA Corporation (NASDAQ: SINA) is expected to report quarterly earnings at $0.42 per share on revenue of $433.32 million. Weibo Corporation (NASDAQ: WB) is projected to report quarterly earnings at $0.47 per share on revenue of $342.39 million. Ameren Corporation (NYSE: AEE) is estimated to report quarterly earnings at $0.57 per share on revenue of $1.55 billion. Mylan N.V. (NASDAQ: MYL) is projected to report quarterly earnings at $0.98 per share on revenue of $2.75 billion. Cinemark Holdings, Inc. (NYSE: CNK) is estimated to report quarterly earnings at $1.31 per share on revenue of $1.51 billion. ADT Inc. (NYSE: ADT) is expected to report quarterly earnings at $0.24 per share on revenue of $1.11 billion. Coty Inc. (NYSE: COTY) is projected to report quarterly earnings at $0.13 per share on revenue of $2.18 billion. Pinnacle Entertainment, Inc. (NYSE: PNK) is estimated to report quarterly earnings at $0.31 per share on revenue of $644.94 million. Conduent Incorporated (NYSE: CNDT) is estimated to report quarterly earnings at $0.21 per share on revenue of $1.44 billion. Delphi Technologies PLC (NYSE: DLPH) is projected to report quarterly earnings at $1.16 per share on revenue of $1.25 billion. Office Depot, Inc. (NASDAQ: ODP) is expected to report quarterly earnings at $0.08 per share on revenue of $2.72 billion. Global Partners LP (NYSE: GLP) is estimated to report quarterly earnings at $0.13 per share on revenue of $2.33 billion. Wolverine World Wide, Inc. (NYSE: WWW) is projected to report quarterly earnings at $0.37 per share on revenue of $530.99 million. Performance Food Group Company (NYSE: PFGC) is expected to report quarterly earnings at $0.32 per share on revenue of $4.46 billion. Groupon, Inc. (NASDAQ: GRPN) is projected to report

Top 5 China Stocks To Watch Right Now: Netease.com Inc.(NTES)

Advisors' Opinion:
  • [By Rick Munarriz]

    Many Chinese growth stocks have started bouncing back, but the same can't be said about�NetEase (NASDAQ:NTES). The Chinese online gaming pioneer hit another 52-week low earlier this month, and it's trading nearly 30% below the all-time highs it hit late last year.�

  • [By Lisa Levin]

    NetEase, Inc. (NASDAQ: NTES) is expected to post quarterly earnings at $2.19 per share on revenue of $2.18 billion.

    China Distance Education Holdings Limited (NYSE: DL) is estimated to post earnings for its second quarter.

  • [By Shane Hupp]

    News articles about NetEase (NASDAQ:NTES) have been trending somewhat positive this week, Accern reports. Accern ranks the sentiment of news coverage by reviewing more than 20 million news and blog sources. Accern ranks coverage of companies on a scale of negative one to one, with scores closest to one being the most favorable. NetEase earned a media sentiment score of 0.23 on Accern’s scale. Accern also assigned news coverage about the technology company an impact score of 47.5808045346287 out of 100, meaning that recent news coverage is somewhat unlikely to have an effect on the company’s share price in the next few days.

  • [By Harsh Chauhan]

    China's booming video gaming industry has turned out to be a big moneymaker for NetEase (NASDAQ:NTES) in recent years. From operating�Activision's popular games such as World of Warcraft and Diablo to building a solid portfolio of self-developed mobile games, NetEase has kept its finger on the pulse of the video gaming market to clock terrific�growth.

  • [By Dan Caplinger]

    Thursday was a relatively quiet day on Wall Street, and action in different parts of the market showed mixed signals for investors. On one hand, small-cap stocks moved higher, with key benchmarks in that area hitting record highs. Yet the better-known large-cap stock indexes like the S&P 500 gave up early gains. Looking more closely at individual stocks, some companies suffered from bad news that sent their shares falling. J.C. Penney (NYSE:JCP), NetEase (NASDAQ:NTES), and Jounce Therapeutics (NASDAQ:JNCE) were among the worst performers on the day. Here's why they did so poorly.

  • [By Ethan Ryder]

    NetEase (NASDAQ:NTES) traded down 0.3% during mid-day trading on Friday after Barclays lowered their price target on the stock to $255.00. Barclays currently has an equal weight rating on the stock. NetEase traded as low as $240.07 and last traded at $246.86. 481,395 shares were traded during mid-day trading, a decline of 60% from the average session volume of 1,205,109 shares. The stock had previously closed at $246.16.

Top 5 China Stocks To Watch Right Now: Renesola Ltd.(SOL)

Advisors' Opinion:
  • [By Joseph Griffin]

    These are some of the media headlines that may have impacted Accern’s scoring:

    Get ReneSola alerts: ReneSola Sells North Carolina Solar Project To Greenbacker (solarindustrymag.com) ReneSola (SOL) Rating Increased to Neutral at Roth Capital (americanbankingnews.com) ReneSola (SOL) Q1 Earnings in Line, Revenues Top Estimates (zacks.com) ReneSola’s (SOL) CEO Xianshou Li on Q1 2018 Results – Earnings Call Transcript (seekingalpha.com) ReneSola (SOL) Releases Earnings Results (americanbankingnews.com)

    Shares of ReneSola traded up $0.08, hitting $2.76, during trading on Friday, Marketbeat.com reports. The stock had a trading volume of 124,969 shares, compared to its average volume of 108,565. The firm has a market capitalization of $102.11 million, a PE ratio of 21.23 and a beta of 2.05. The company has a current ratio of 1.17, a quick ratio of 1.17 and a debt-to-equity ratio of 0.36. ReneSola has a 12 month low of $2.12 and a 12 month high of $3.79.

Wednesday, July 11, 2018

By The Numbers: Industrials With Big Cash Distributions

The industrials sector is home to many particularly solid and profitable corporations with strong competitive advantages. On the other hand, the sector is also quite cyclical and challenging, so it��s particularly important to pick the right names when investing in the industrials sector.

There's no infallible formula to picking winning stocks, but the statistical evidence indicates that companies with big cash distributions tend to deliver above-average returns over the long term, and this makes perfect sense from a fundamental investing point of view. With this in mind, the following article will be introducing a quantitative system to pick industrials stocks based on their capital distributions via dividends, buybacks, and debt cancellations.

On Dividends And Beyond

When talking about cash distributions, most people tend to think first and foremost about dividends, which are arguably the most transparent and straightforward way to return capital to investors. On the other hand, shareholder yield can be a more holistic approach to cash distributions. In a nutshell, shareholder yield is a cash distribution metric that includes not only dividends, but also share buybacks and debt cancellations.

The convenience of buybacks over dividends ultimately depends on the particular case. If the stock is undervalued and business prospects are good, then buybacks can create a lot of value for shareholders, because the company is investing its capital in an undervalued asset, meaning its own stock. On the other hand, when the business is deteriorating or the stock is excessively priced, then buybacks have a negative impact on shareholder value.

By including debt paydowns in the equation, shareholder yield avoids situations in which companies finance their dividends and buybacks with borrowed money. Opportunistically issuing debt to finance cash distributions is not necessarily a bad thing, and it can even be a smart move under the right conditions. Nevertheless, money coming from internally generated funds as opposed to debt is a more sustainable and genuine source of capital distributions over the long term.

Importantly, these different venues of cash distributions are intimately related. Many companies tend to first cancel their debt when they have excess cash flow, then repurchase stock, and ultimately allocate those excess cash flows to dividend payments as the business matures over time. This means that companies making big debt cancellations and share buybacks today are many times the big dividend payers of tomorrow.

The main point is that cash distributions through multiple venues say a lot about a company and its financial strength, and shareholder yield can offer a big-picture perspective on cash distributions that is more comprehensive than dividends alone.

Besides, it��s one thing to say that a company looks undervalued in comparison to earnings and similar accounting metrics, since this can sometimes seem like an ephemeral concept to many investors. On the other hand, when the stock is cheap in comparison to cold-hard cash distributions, then undervaluation becomes a far more tangible idea.

Backtested Performance And Recommended Portfolio

The following backtest considers only companies in the industrials sector and it excludes over the counter stocks to guarantee a minimum size and liquidity level. The system then picks the 50 stocks with the highest shareholder yield in that universe and builds an equally weighted portfolio with those names. The portfolio is rebalanced every four weeks and it has an assumed annual expense ratio of 1% to account for trading commissions. The benchmark is the Industrial Select Sector SPDR ETF (XLI).

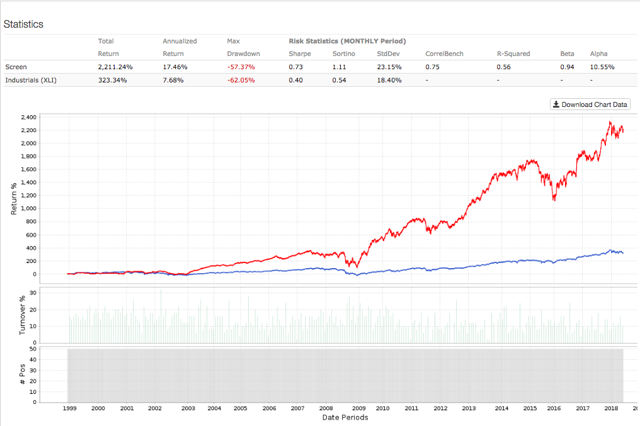
Data from S&P Global via Portfolio123

Backtested performance numbers are remarkable. Since January of 1999 the system gained 17.46% per year, far surpassing the 7.68% per year generated by the Industrial Select Sector SPDR ETF in the same period. In other words, a $100,000 investment in the sector-tracking ETF in January of 1999 would currently be worth around $423,300, and the same amount of capital allocated to the quantitative system would have an exponentially larger value of over $2.3 million.

The table below shows the 50 stocks selected by the system, data also includes market capitalization in million dollars and shareholder yield over the past 12 months.

Name

MktCap

S. Yield

Boeing (BA)

$195,504

7%

Union Pacific (UNP)

$110,516

6%

CSX Corp. (CSX)

$56,898

6%

Delta Air Lines (DAL)

$34,829

7%

Eaton Corp. (ETN)

$33,244

6%

Southwest Airlines (LUV)

$30,579

6%

Ingersoll-Rand (IR)

$22,288

6%

Cummins (CMI)

$21,589

6%

United Continental (UAL)

$19,827

10%

TransDigm Group (TDG)

$18,219

7%

American Airlines Group (AAL)

$17,803

10%

Spirit AeroSystems Holdings (SPR)

$9,653

6%

HD Supply Holdings (HDS)

$7,974

8%

Fortune Brands Home & Security (FBHS)

$7,960

7%

Carlisle Companies (CSL)

$6,823

7%

JetBlue Airways (JBLU)

$6,146

6%

Allison Transmission Holdings (ALSN)

$5,555

12%

Graftech International (EAF)

$5,549

20%

Macquarie Infrastructure (MIC)

$3,720

11%

Terex Corp. (TEX)

$3,247

28%

GATX Corp. (GATX)

$2,839

6%

Avis Budget Group (CAR)

$2,706

6%

Allegiant Travel (ALGT)

$2,326

6%

Covanta Holding (CVA)

$2,220

6%

Masonite International (DOOR)

$2,016

7%

Hawaiian Holdings (HA)

$1,846

7%

Pitney Bowes (PBI)

$1,705

8%

Aircastle (AYR)

$1,607

6%

Interface (TILE)

$1,425

6%

NCI Building Systems (NCS)

$1,406

6%

Quad/Graphics (QUAD)

$1,149

6%

Wabash National (WNC)

$1,129

7%

Atkore International Group (ATKR)

$984

34%

Griffon Corp. (GFF)

$842

6%

Avianca Holdings SA (AVH)

$820

8%

Blue Bird Corp. (BLBD)

$545

6%

LSC Communications (LKSD)

$483

7%

CRA International (CRAI)

$447

7%

R.R. Donnelley & Sons (RRD)

$407

10%

Fly Leasing (FLY)

$391

14%

Armstrong Flooring (AFI)

$374

9%

Safe Bulkers (SB)

$349

11%

Babcock & Wilcox Enterprises (BW)

$99

18%

Limbach Holdings (LMB)

$89

16%

Cypress Energy Partners LP (CELP)

$89

8%

RCM Technologies (RCMT)

$60

20%

Alpha Pro Tech (APT)

$48

8%

L.S. Starrett (SCX)

$46

6%

Globus Maritime (GLBS)

$17

87%

Staffing 360 Solutions (STAF)

$6

31%

Please keep in mind that only because a company has an elevated shareholder yield over the past year, that does not guarantee that such yield is sustainable going forward. Besides, cheap stocks are sometimes cheap for a good reason, so investors need to do their own homework and take a deep look at the company behind the numbers before making any buy or sell decisions based on metrics such as shareholder yield.

That acknowledged, there is plenty of statistical data proving that companies with elevated shareholder yield tend to deliver above-average returns, and my own backtesting work confirms that focusing on shareholder yield in the industrials sector can produce attractive returns over the long term. For this reason, a quantitative system such as this one can be a valuable tool to identify promising investing ideas for further research.

Capitalize on the power of data and technology to take the guesswork out of your investment decisions. Statistical research has proven that stocks and ETFs showing certain quantitative attributes tend to outperform the market over the long term. A subscription to The Data Driven Investor provides you access to profitable screeners and live portfolios based on these effective and time-proven return drivers. Forget about opinions and speculation, investing decisions based on cold-hard quantitative data can provide you superior returns with lower risk. Click here to get your free trial now.

Disclosure: I/we have no positions in any stocks mentioned, and no plans to initiate any positions within the next 72 hours.

I wrote this article myself, and it expresses my own opinions. I am not receiving compensation for it (other than from Seeking Alpha). I have no business relationship with any company whose stock is mentioned in this article.

Editor's Note: This article covers one or more stocks trading at less than $1 per share and/or with less than a $100 million market cap. Please be aware of the risks associated with these stocks.

Tuesday, July 10, 2018

Buy Graphite India; target of Rs 1250: ICICI Direct


ICICI Direct's research report on Graphite India

Graphite India has been one of the better wealth creators for investors with the stock price nearly multiplying ~5.5x since our Sector Update in July 2017. The graphite electrode sector has been on a dream run since the start of CY17 driven by 1) consolidation of the graphite electrode market globally, 2) ~20% of global graphite electrode capacity (ex-China) shutting down in the last four years, 3) increase in steel production through EAF route coupled with an increase in global steel prices, 4) decline in both steel and graphite electrode exports from China on account of capacity closures.

Outlook

We change our valuation methodology and now value the stock on a P/E basis. We value the stock at 10x FY20E EPS of | 125 thereby arriving at a target price of | 1250, maintaining our BUY recommendation. Graphite India has a robust balance sheet, net cash status and healthy cash flow generation, which augurs well. Currently, the company��s net cash balance was at | 991 crore as on March 31, 2018, which is likely to increase to ~| 3053 crore in FY20E reflecting a cash per share of | 156/share (in FY20E).

For all recommendations report,�click here

related news Buy NCL Industries; target of Rs 210: ICICI Direct Buy Voltas; target of Rs 680: JM Financial Buy NBCC Ltd; target of Rs 95: ICICI Direct

Disclaimer:�The views and investment tips expressed by investment experts/broking houses/rating agencies on moneycontrol.com are their own, and not that of the website or its management. Moneycontrol.com advises users to check with certified experts before taking any investment decisions.

Read More First Published on Jul 10, 2018 03:25 pm

Monday, July 9, 2018

Vision Capital Management Inc. Purchases New Holdings in iShares Russell 2000 Index (IWM)

Vision Capital Management Inc. purchased a new stake in shares of iShares Russell 2000 Index (NYSEARCA:IWM) in the 2nd quarter, according to the company in its most recent 13F filing with the SEC. The firm purchased 1,266 shares of the exchange traded fund’s stock, valued at approximately $207,000.

A number of other hedge funds and other institutional investors have also recently added to or reduced their stakes in IWM. California Public Employees Retirement System purchased a new position in iShares Russell 2000 Index during the 4th quarter valued at approximately $312,000. First Trust Advisors LP grew its holdings in iShares Russell 2000 Index by 5.1% during the 4th quarter. First Trust Advisors LP now owns 12,563 shares of the exchange traded fund’s stock valued at $1,915,000 after buying an additional 609 shares in the last quarter. Rhumbline Advisers grew its holdings in iShares Russell 2000 Index by 39.6% during the 4th quarter. Rhumbline Advisers now owns 19,451 shares of the exchange traded fund’s stock valued at $2,965,000 after buying an additional 5,516 shares in the last quarter. UBS Asset Management Americas Inc. grew its holdings in iShares Russell 2000 Index by 12.0% during the 4th quarter. UBS Asset Management Americas Inc. now owns 39,239 shares of the exchange traded fund’s stock valued at $5,982,000 after buying an additional 4,213 shares in the last quarter. Finally, Kennedy Capital Management Inc. purchased a new position in iShares Russell 2000 Index during the 4th quarter valued at approximately $320,000.

Get iShares Russell 2000 Index alerts:

NYSEARCA IWM traded up $1.31 during trading on Friday, hitting $168.15. 2,739,103 shares of the stock traded hands, compared to its average volume of 22,602,986. iShares Russell 2000 Index has a 12-month low of $134.12 and a 12-month high of $170.20.

The business also recently announced a quarterly dividend, which will be paid on Tuesday, July 10th. Stockholders of record on Thursday, July 5th will be issued a $0.5952 dividend. This is a boost from iShares Russell 2000 Index’s previous quarterly dividend of $0.58. The ex-dividend date is Tuesday, July 3rd. This represents a $2.38 dividend on an annualized basis and a dividend yield of 1.42%.

About iShares Russell 2000 Index

iShares Russell 2000 ETF (the Fund) is an exchange-traded fund. The Fund seeks investment results that correspond generally to the price and yield performance of the Russell 2000 Index (the Index). The Index is a float-adjusted capitalization weighted index that measures the performance of the small-capitalization sector of the United States equity market and includes securities issued by the approximately 2,000 smallest issuers in the Russell 3000 Index.

Want to see what other hedge funds are holding IWM? Visit HoldingsChannel.com to get the latest 13F filings and insider trades for iShares Russell 2000 Index (NYSEARCA:IWM).

Institutional Ownership by Quarter for iShares Russell 2000 Index (NYSEARCA:IWM)

Saturday, July 7, 2018

Reasons we don't want a trade war with China

Just a quick version of where things stand as of this writing: President Trump has targeted $50 billion worth of Chinese imports with 10% tariffs. China is threatening retaliatory tariffs of their own on goods we export to that country. If China does indeed retaliate, the President has now threatened tariffs on $200 billion in Chinese imports -- four times the initial target.

Whether this turns into a full-blown trade war or not is anyone��s guess at this point. However, there are some clear disadvantages to a trade war that Americans should be aware of.

ALSO READ: What Stocks Perform Well in the Midst of a Trade War?

Man opens wallet and dollar bills fly out. (Photo: Getty Images)

Costs of everyday products could increase

A trade war could impact Americans�� wallets in several ways, including higher prices on items we buy every day. Specifically, tariffs on imported materials are likely to be passed on to consumers.

In some ways this could be minimal. If a food manufacturer uses a small amount of, say, imported aluminum to make their packaging, the additional cost to you is likely to be negligible. However, there could be large increases on some products�� prices.

For example, let��s say that an appliance manufacturer uses $100 worth of imported steel when making a product. If there��s a 25% tariff added to the steel, the manufacturer��s cost will increase by $25, which is likely to be passed on to the consumer in the form of higher prices.

From China specifically, we import quite a bit of electronics, toys, and clothing, just to name a few categories, so you may notice these things start to cost more if tariffs go into effect.

Interest rates on pieces of cut out paper. (Photo: Getty Images)

Inflation could lead to even higher interest rates

When the costs of goods and services rise, we call that�inflation. As of June 2018, inflation is running right about 2% per year -- right where the Federal Reserve wants it.

If inflation picks up because of higher costs to consumers, the Federal Reserve is likely to raise interest rates even faster than it currently plans to do. The Fed already plans to do about eight more quarter-percent rate hikes by the end of 2020 based on its�current inflation projections, which aren��t much higher than its 2% target.

This could make the cost of borrowing money higher for all U.S. consumers, as bank lending rates tend to move in the same direction as Federal Reserve interest rate activity.

A pile of four different credit cards. (Photo: Getty Images)

Credit card interest rates could see a spike

One of the most direct effects of Federal Reserve interest rate hikes is higher credit card APRs. Credit card interest rates are generally derived from the Prime Rate, which is directly linked to the Federal Funds Rate -- the interest rate the Federal Reserve moves up and down.

Let��s say that you have a credit card that currently has a 16.99% APR. Based on the Fed��s current projections of eight 25-basis-point rate hikes by the end of 2020, you can expect your APR to gradually rise to 18.99% over the next couple of years. However, if the Fed gets more aggressive with its rate hikes because of inflation, your APR could easily get significantly higher.

ALSO READ: These 3 Companies Could Be Huge Trade War Casualties

Man in suit holds his head while looking at plunging line graphs. (Photo: Getty Images)

Economic activity could drop

The economy has been firing on all cylinders, but that could come to a screeching halt if a trade war escalates.

In April, the Tax Foundation determined that the proposed tariffs on high-tech Chinese imports would lower GDP and wage growth by 0.1%. What��s more, it would cost the U.S. 79,000 jobs. And keep in mind that this is just one type of proposed tariff. The effects of a full-blown trade war could be much more severe.

Furthermore, the Brookings Institution estimates that as many as 2.1 million U.S. jobs could be affected by China��s initial retaliatory tariffs alone. The University of Pennsylvania said that an all-out trade war would reduce U.S. GDP by 0.9% by 2027, and wages by 1.1%.

In a nutshell, a trade war could be bad news for the U.S. economy and could derail our growth trajectory.

Stock quotes page of newspaper. (Photo: Getty Images)

Stocks could take a hit

Higher interest rates, higher costs of goods and services, and reduced economic activity are not positive catalysts for the stock market. Higher interest rates generally lead to lower consumer spending, and the same can be said for higher prices.

So, if an all-out trade war breaks out, you can expect it to put negative pressure on stocks. Income-focused stocks, such as REITs and other high-dividend stocks, are especially vulnerable to rising rates, although all stocks could feel the squeeze from generally lower economic activity.

Couple looking at bills with hands over their mouths. (Photo: Getty Images)

Not good for consumers or investors

The bottom line is that a trade war could make life more expensive and could make your investments lose value.

To be perfectly clear, we��re not in an all-out trade war with China (or anyone else) just yet, but it certainly appears that we��re getting closer by the day. And, it��s important to know what to expect if it happens.


The Motley Fool has a�disclosure policy.The Motley Fool is a USA TODAY content partner offering financial news, analysis and commentary designed to help people take control of their financial lives. Its content is produced independently of USA TODAY.

Offer from the Motley Fool:�10 stocks we like better than BlackLine, Inc.
When investing geniuses David and Tom Gardner have a stock tip, it can pay to listen. After all, the newsletter they have run for over a decade,�Motley Fool Stock Advisor, has quadrupled the market.*

David and Tom just revealed what they believe are the�10 best stocks�for investors to buy right now... and BlackLine, Inc. wasn't one of them! That's right -- they think these 10 stocks are even better buys.

Click here�to learn about these picks!

*Stock Advisor returns as of June 4, 2018

Friday, July 6, 2018

Top Energy Stocks To Own For 2019

tags:GWRE,ACBFF,CCRN, Related UGAZ Will Qatar Blockade Quandary Create A Catalyst For U.S. Gas Companies? Nat Gas Investors Gauging Pricing Impact Of Fickle Winter Weather Related UNG Oil Market Not Improving As Quickly As Expected, Analyst Cuts Price Outlook Alan Knuckman's US Natural Gas Fund Trade

Natural gas stocks and ETNs like United States Natural Gas Fund (NYSE: UNG) and VelocityShares 3x Long Natural Gas ETN (NYSE: UGAZ) may see an uncommon catalyst this week — a solar eclipse.

On Monday, the moon, sun and Earth will be in perfect alignment for some of the continental United States, with the moon temporarily blocking the Earth from the sun. America’s solar power will be reduced by more than 10,000 megawatts, causing nat gas generators to help fill the void in energy demand.

Top Energy Stocks To Own For 2019: Guidewire Software, Inc.(GWRE)

Advisors' Opinion:
  • [By Motley Fool Staff]

    Guidewire Software, Inc. (NYSE:GWRE)Q3 2018 Earnings Conference CallJune 5, 2018, 5:00 p.m. ET

    Contents: Prepared Remarks Questions and Answers Call Participants Prepared Remarks:

    Operator

  • [By Max Byerly]

    Shares of Guidewire Software Inc (NYSE:GWRE) have received an average rating of “Buy” from the thirteen research firms that are presently covering the firm, MarketBeat reports. One investment analyst has rated the stock with a sell recommendation, two have assigned a hold recommendation and nine have issued a buy recommendation on the company. The average 1-year price objective among brokerages that have issued ratings on the stock in the last year is $95.00.

  • [By Max Byerly]

    Verition Fund Management LLC bought a new position in shares of Guidewire Software Inc (NYSE:GWRE) in the first quarter, according to the company in its most recent disclosure with the Securities and Exchange Commission. The fund bought 2,731 shares of the technology company’s stock, valued at approximately $221,000.

Top Energy Stocks To Own For 2019: Aurora Cannabis Inc. (ACBFF)

Advisors' Opinion:
  • [By Sean Williams]

    It just so happens that one of Canada's top two players in the cannabis industry, Aurora Cannabis (NASDAQOTH:ACBFF), reported its third-quarter operating results on May 8 and updated investors on what to expect going forward. Given its importance to the domestic Canadian pot industry -- the company expects to generate 430,000 kilograms of cannabis a year at full capacity -- it pays to keep tabs on Aurora's growth and how its projects are progressing. That said, here are the 10 things you should know about Aurora Cannabis' Q3 report.�

  • [By Shanthi Rexaline]

    Aurora Cannabis Inc (OTC: ACBFF) recently announced a deal to buy MedReleaf Corp (OTC: MEDFF) in an all-cash transaction valued at C$3.2 billion.

  • [By Sean Williams]

    Perhaps the one company that could give Canopy Growth a run for its money is Aurora Cannabis (NASDAQOTH:ACBFF). Having begun the year with an estimated annual production capacity of just over 100,000 kilograms of cannabis, Aurora Cannabis is now expected to generate 570,000 kilograms a year, when at full capacity. This added capacity comes from its acquisition of CanniMed Therapeutics, its pending all-share buyout of MedReleaf, its joint venture with Alfred Pedersen & Son (known as Aurora Nordic), and its announced 1.2-million-square-foot greenhouse project in Medicine Hat, Alberta, to be known as Aurora Sun.

  • [By Keith Speights]

    Up until this week, the biggest marijuana stock deal of all time was Aurora Cannabis' (NASDAQOTH:ACBFF) acquisition of CanniMed Therapeutics earlier this year for $852 million. Now, though, another Aurora transaction is taking the No. 1 spot.

  • [By ]

    The three companies we consider most potent for future growth in value are Canopy Growth Corp. (NYSE:CGC), Aurora Cannabis (OTCQX:ACBFF), and Aphria (OTCQB:APHQF). Canopy is a diversified cannabis company that both produces and sells cannabis products for the Canadian medical cannabis market. The company is well-positioned to start growing for recreational use once it becomes legal. Aurora's focus is also on both growing and selling medical cannabis and produces both psychoactive THC products and medically oriented CBD products. It has an aggressive growth and acquisition strategy, also having conducted the largest acquisition in the cannabis industry when acquiring CanniMed Therapeutics earlier this year. Aphria is another grower and seller of medical marijuana, which conducts its sales through retail stores and wholesale distribution. All three companies have well-positioned themselves in the Canadian market and could be potential target companies for Big Tobacco or Big Alcohol or turn into major market leaders.

  • [By Keith Speights]

    There have already been several big mergers and acquisitions among Canadian marijuana growers over the last couple of years. The biggest deal so far was Aurora Cannabis' (NASDAQOTH:ACBFF) once-hostile but later�friendly takeover of CanniMed Therapeutics. Now it seems that Aurora might be itching for an even bigger deal.

Top Energy Stocks To Own For 2019: Cross Country Healthcare, Inc.(CCRN)

Advisors' Opinion:
  • [By Lisa Levin]


    Losers Heat Biologics, Inc. (NASDAQ: HTBX) shares tumbled 48.59 percent to close at $1.275 on Thursday after the company priced its $18,000,000 public offering. InVivo Therapeutics Holdings Corp. (NASDAQ: NVIV) fell 38.77 percent to close at $8.26 on Thursday. Check-Cap Ltd. (NASDAQ: CHEK) shares tumbled 27.43 percent to close at $8.81. Achaogen, Inc. (NASDAQ: AKAO) dropped 24.76 percent to close at $11.06 in reaction to a disappointing update from an FDA AdCom panel. The FDA panel voted favorably for the company's Plazcomicin for treatment of adults with complicated urinary tract infections, but also voted against the therapy to be used as a treatment for bloodstream infections. Anika Therapeutics, Inc. (NASDAQ: ANIK) shares declined 24.68 percent to close at $34.80 after the company posted downbeat quarterly results. LSC Communications, Inc. (NASDAQ: LKSD) shares fell 24.22 percent to close at $12.64 following wider-than-expected Q1 loss. Cardinal Health, Inc. (NYSE: CAH) fell 21.42 percent to close at $50.80 following downbeat quarterly profit. Horizon Global Corporation (NYSE: HZN) dropped 20.42 percent to close at $6.00 following downbeat quarterly earnings. Hornbeck Offshore Services, Inc. (NYSE: HOS) slipped 20.11 percent to close at $2.90 following wider-than-expected Q1 loss. Esperion Therapeutics, Inc. (NASDAQ: ESPR) fell 19.28 percent to close at $36.93. Esperion Therapeutics stock lost roughly a third of its value Wednesday after the company reported mixed Phase III results for its leading drug candidate, bempedoic acid. JP Morgan downgraded Esperion Therapeutics from Neutral to Underweight. Laredo Petroleum, Inc. (NYSE: LPI) declined 17.77 percent to close at $8.98 after the company reported weaker-than-expected Q1 earnings. The Habit Restaurants, Inc. (NASDAQ: HABT) dipped 16.1 percent to close at $8.60 after the company reported downbeat quarterly results. Arcadia Biosciences, Inc. (N
  • [By Joseph Griffin]

    Cross Country Healthcare, Inc. (NASDAQ:CCRN) has received an average recommendation of “Buy” from the thirteen ratings firms that are presently covering the stock, Marketbeat reports. Seven investment analysts have rated the stock with a hold rating, four have issued a buy rating and one has assigned a strong buy rating to the company. The average 1-year price objective among brokers that have updated their coverage on the stock in the last year is $14.00.

  • [By ]

    Activist investor Glenn Welling of Engaged Capital LLC, the insurgent investor agitating for changes at TiVo, Rent-a-Center, on Tuesday, May 15, revealed new positions in Aratana Therapeutics Inc. (PETX) , Cross Country Healthcare Inc. (CCRN)  and Finisar Corp. (FNSR)

Wednesday, July 4, 2018

Head-To-Head Analysis: Artesian Resources Co. Class A (ARTNA) versus Pure Cycle (PCYO)

Artesian Resources Co. Class A (NASDAQ: ARTNA) and Pure Cycle (NASDAQ:PCYO) are both small-cap utilities companies, but which is the better investment? We will contrast the two companies based on the strength of their dividends, risk, analyst recommendations, valuation, institutional ownership, profitability and earnings.

Risk & Volatility

Get Artesian Resources Co. Class A alerts:

Artesian Resources Co. Class A has a beta of 0.11, indicating that its stock price is 89% less volatile than the S&P 500. Comparatively, Pure Cycle has a beta of 0.5, indicating that its stock price is 50% less volatile than the S&P 500.

Profitability

This table compares Artesian Resources Co. Class A and Pure Cycle’s net margins, return on equity and return on assets.

Net Margins Return on Equity Return on Assets
Artesian Resources Co. Class A 17.54% 10.49% 3.15%
Pure Cycle -40.01% -1.53% -1.50%

Dividends

Artesian Resources Co. Class A pays an annual dividend of $0.95 per share and has a dividend yield of 2.5%. Pure Cycle does not pay a dividend. Artesian Resources Co. Class A pays out 41.3% of its earnings in the form of a dividend.

Analyst Recommendations

This is a breakdown of recent ratings for Artesian Resources Co. Class A and Pure Cycle, as provided by MarketBeat.

Sell Ratings Hold Ratings Buy Ratings Strong Buy Ratings Rating Score
Artesian Resources Co. Class A 0 0 0 0 N/A
Pure Cycle 0 0 0 0 N/A

Institutional and Insider Ownership

38.5% of Artesian Resources Co. Class A shares are held by institutional investors. Comparatively, 66.3% of Pure Cycle shares are held by institutional investors. 20.6% of Artesian Resources Co. Class A shares are held by insiders. Comparatively, 4.8% of Pure Cycle shares are held by insiders. Strong institutional ownership is an indication that large money managers, endowments and hedge funds believe a company is poised for long-term growth.

Earnings and Valuation

This table compares Artesian Resources Co. Class A and Pure Cycle’s top-line revenue, earnings per share and valuation.

Gross Revenue Price/Sales Ratio Net Income Earnings Per Share Price/Earnings Ratio
Artesian Resources Co. Class A $82.24 million 4.30 $13.98 million $2.30 16.66
Pure Cycle $1.22 million 192.81 -$1.71 million N/A N/A

Artesian Resources Co. Class A has higher revenue and earnings than Pure Cycle.

Summary

Artesian Resources Co. Class A beats Pure Cycle on 7 of the 11 factors compared between the two stocks.

About Artesian Resources Co. Class A

Artesian Resources Corporation, through its subsidiaries, provides water, wastewater, and other services on the Delmarva Peninsula. The company distributes and sells water to residential, commercial, industrial, governmental, municipal, and utility customers, as well as for public and private fire protection in the states of Delaware, Maryland, and Pennsylvania; and offers wastewater services to customers in Delaware. It also provides contract water and wastewater services; water, sewer, and internal service line protection plans; and wastewater management services, as well as design, construction, and engineering services. In addition, the company offers services to other water utilities, including operations and billing functions; and owns real estate properties, including land for office buildings, a water treatment plant, and wastewater facility. As of December 31, 2017, it served approximately 84,200 metered water customers in Delaware, 2,300 metered water customers in Maryland, and 40 customers in Pennsylvania through 1,293 miles of transmission and distribution mains. Artesian Resources Corporation was founded in 1905 and is headquartered in Newark, Delaware.

About Pure Cycle

Pure Cycle Corporation designs, constructs, operates, and maintains water and wastewater systems in the Denver metropolitan area and Colorado Front Range in the United States. It provides water production, storage, treatment, retail distribution systems bulk transmission, wastewater collection and treatment, irrigation water treatment and transmission, construction management, billing and collection, and emergency response services. The company offers its services to wholesale customers, which include commercial and industrial customers, and local governmental entities that provide water and wastewater services to their end-use customers. It also leases its farms. The company was founded in 1976 and is based in Watkins, Colorado.

Sunday, June 24, 2018

Zacks: Analysts Anticipate MedEquities Realty Trust Inc (MRT) Will Post Earnings of $0.30 Per Share

Equities analysts expect MedEquities Realty Trust Inc (NYSE:MRT) to announce $0.30 earnings per share for the current quarter, according to Zacks. Two analysts have made estimates for MedEquities Realty Trust’s earnings, with the highest EPS estimate coming in at $0.31 and the lowest estimate coming in at $0.29. MedEquities Realty Trust reported earnings per share of $0.27 in the same quarter last year, which indicates a positive year over year growth rate of 11.1%. The business is scheduled to announce its next quarterly earnings results on Tuesday, August 14th.

According to Zacks, analysts expect that MedEquities Realty Trust will report full-year earnings of $1.20 per share for the current financial year, with EPS estimates ranging from $1.19 to $1.22. For the next fiscal year, analysts expect that the company will report earnings of $1.25 per share, with EPS estimates ranging from $1.22 to $1.27. Zacks’ EPS calculations are a mean average based on a survey of research firms that cover MedEquities Realty Trust.

Get MedEquities Realty Trust alerts:

MedEquities Realty Trust (NYSE:MRT) last announced its quarterly earnings results on Thursday, May 10th. The financial services provider reported $0.16 earnings per share for the quarter, missing the Thomson Reuters’ consensus estimate of $0.30 by ($0.14). MedEquities Realty Trust had a net margin of 34.63% and a return on equity of 6.17%. The company had revenue of $16.72 million for the quarter, compared to the consensus estimate of $16.41 million.

MRT has been the topic of several analyst reports. KeyCorp decreased their price target on MedEquities Realty Trust from $13.00 to $12.00 and set an “overweight” rating on the stock in a research report on Monday, April 16th. ValuEngine lowered MedEquities Realty Trust from a “buy” rating to a “hold” rating in a report on Friday, February 23rd. Citigroup cut their price objective on MedEquities Realty Trust from $12.00 to $10.00 and set a “neutral” rating for the company in a report on Thursday, March 1st. B. Riley set a $13.00 price objective on MedEquities Realty Trust and gave the stock a “buy” rating in a report on Thursday, February 22nd. Finally, Royal Bank of Canada reissued a “sector perform” rating and set a $11.00 price objective (down previously from $12.00) on shares of MedEquities Realty Trust in a report on Wednesday, May 23rd. One research analyst has rated the stock with a sell rating, four have issued a hold rating and four have assigned a buy rating to the stock. The stock presently has an average rating of “Hold” and a consensus price target of $12.25.

Shares of MRT traded down $0.01 during midday trading on Friday, hitting $10.59. 398,600 shares of the company traded hands, compared to its average volume of 155,375. MedEquities Realty Trust has a one year low of $9.67 and a one year high of $13.06. The stock has a market cap of $343.74 million, a PE ratio of 9.29 and a beta of -0.12.

The firm also recently disclosed a quarterly dividend, which was paid on Tuesday, June 5th. Stockholders of record on Tuesday, May 22nd were issued a dividend of $0.21 per share. This represents a $0.84 annualized dividend and a dividend yield of 7.93%. The ex-dividend date of this dividend was Monday, May 21st. MedEquities Realty Trust’s payout ratio is 73.68%.

In other news, Director Bluemountain Capital Managemen sold 17,674 shares of the business’s stock in a transaction dated Friday, May 4th. The stock was sold at an average price of $10.16, for a total transaction of $179,567.84. The sale was disclosed in a document filed with the Securities & Exchange Commission, which is accessible through this hyperlink. Insiders have sold 363,688 shares of company stock valued at $3,756,271 in the last three months. 2.50% of the stock is owned by insiders.

Institutional investors and hedge funds have recently modified their holdings of the business. LSV Asset Management purchased a new stake in MedEquities Realty Trust in the fourth quarter worth approximately $103,000. MetLife Investment Advisors LLC purchased a new stake in MedEquities Realty Trust in the fourth quarter worth approximately $120,000. Barclays PLC boosted its stake in MedEquities Realty Trust by 252.2% in the first quarter. Barclays PLC now owns 16,016 shares of the financial services provider’s stock worth $168,000 after buying an additional 11,469 shares in the last quarter. JPMorgan Chase & Co. boosted its stake in MedEquities Realty Trust by 221.9% in the first quarter. JPMorgan Chase & Co. now owns 19,898 shares of the financial services provider’s stock worth $210,000 after buying an additional 13,717 shares in the last quarter. Finally, UBS Group AG boosted its stake in MedEquities Realty Trust by 52.3% in the first quarter. UBS Group AG now owns 23,234 shares of the financial services provider’s stock worth $244,000 after buying an additional 7,978 shares in the last quarter. 93.53% of the stock is owned by institutional investors and hedge funds.

MedEquities Realty Trust Company Profile

MedEquities Realty Trust (NYSE: MRT) is a self-managed and self-administered real estate investment trust that invests in a diversified mix of healthcare properties and healthcare-related real estate debt investments. The Company's management team has extensive industry experience in acquiring, owning, developing, financing, operating, leasing and monetizing many types of healthcare properties and portfolios.

Get a free copy of the Zacks research report on MedEquities Realty Trust (MRT)

For more information about research offerings from Zacks Investment Research, visit Zacks.com

Earnings History and Estimates for MedEquities Realty Trust (NYSE:MRT)

Wednesday, June 20, 2018

Gilead Sciences, Inc. (GILD) Holdings Lifted by Xact Kapitalforvaltning AB

Xact Kapitalforvaltning AB raised its stake in Gilead Sciences, Inc. (NASDAQ:GILD) by 4.7% during the first quarter, according to its most recent disclosure with the Securities and Exchange Commission (SEC). The fund owned 261,826 shares of the biopharmaceutical company’s stock after buying an additional 11,835 shares during the quarter. Xact Kapitalforvaltning AB’s holdings in Gilead Sciences were worth $19,739,000 at the end of the most recent quarter.

A number of other hedge funds and other institutional investors also recently bought and sold shares of the business. Handelsbanken Fonder AB lifted its position in Gilead Sciences by 19.4% in the first quarter. Handelsbanken Fonder AB now owns 239,870 shares of the biopharmaceutical company’s stock valued at $18,084,000 after buying an additional 39,000 shares during the last quarter. Gables Capital Management Inc. acquired a new stake in shares of Gilead Sciences during the first quarter worth about $1,228,000. Atlantic Trust Group LLC lifted its position in shares of Gilead Sciences by 9.4% during the first quarter. Atlantic Trust Group LLC now owns 185,521 shares of the biopharmaceutical company’s stock worth $13,988,000 after purchasing an additional 15,939 shares in the last quarter. Doheny Asset Management CA lifted its position in shares of Gilead Sciences by 47.4% during the first quarter. Doheny Asset Management CA now owns 35,006 shares of the biopharmaceutical company’s stock worth $2,639,000 after purchasing an additional 11,255 shares in the last quarter. Finally, NEXT Financial Group Inc lifted its position in shares of Gilead Sciences by 75.0% during the first quarter. NEXT Financial Group Inc now owns 6,939 shares of the biopharmaceutical company’s stock worth $523,000 after purchasing an additional 2,974 shares in the last quarter. 77.60% of the stock is currently owned by institutional investors.

Get Gilead Sciences alerts:

Several brokerages have recently issued reports on GILD. BidaskClub cut shares of Gilead Sciences from a “sell” rating to a “strong sell” rating in a research report on Friday, May 4th. Barclays reduced their price target on shares of Gilead Sciences from $95.00 to $90.00 and set a “buy” rating on the stock in a research report on Wednesday, May 2nd. Leerink Swann set a $72.00 price target on shares of Gilead Sciences and gave the stock a “market perform” rating in a research report on Wednesday, May 2nd. Needham & Company LLC reissued a “hold” rating on shares of Gilead Sciences in a research report on Wednesday, May 2nd. Finally, Zacks Investment Research cut shares of Gilead Sciences from a “buy” rating to a “hold” rating in a research report on Monday, May 7th. One equities research analyst has rated the stock with a sell rating, ten have issued a hold rating, sixteen have issued a buy rating and one has issued a strong buy rating to the company. The stock presently has a consensus rating of “Buy” and a consensus target price of $88.00.

In other news, Director John C. Martin sold 50,000 shares of the stock in a transaction that occurred on Friday, June 1st. The stock was sold at an average price of $68.13, for a total value of $3,406,500.00. Following the completion of the sale, the director now directly owns 3,067,762 shares of the company’s stock, valued at $209,006,625.06. The transaction was disclosed in a filing with the Securities & Exchange Commission, which is available through this hyperlink. Also, Director John Francis Cogan sold 5,833 shares of the stock in a transaction that occurred on Friday, March 23rd. The shares were sold at an average price of $75.02, for a total value of $437,591.66. Following the completion of the sale, the director now directly owns 58,452 shares of the company’s stock, valued at $4,385,069.04. The disclosure for this sale can be found here. Insiders sold 185,001 shares of company stock worth $13,226,824 over the last quarter. 1.16% of the stock is currently owned by insiders.

Shares of Gilead Sciences stock opened at $69.06 on Tuesday. The company has a market capitalization of $91.32 billion, a price-to-earnings ratio of 8.07, a P/E/G ratio of -6.11 and a beta of 1.15. Gilead Sciences, Inc. has a 52 week low of $64.02 and a 52 week high of $89.54. The company has a debt-to-equity ratio of 1.32, a quick ratio of 2.75 and a current ratio of 2.84.

Gilead Sciences (NASDAQ:GILD) last announced its quarterly earnings results on Tuesday, May 1st. The biopharmaceutical company reported $1.48 EPS for the quarter, missing the Thomson Reuters’ consensus estimate of $1.67 by ($0.19). The company had revenue of $5.09 billion during the quarter, compared to analysts’ expectations of $5.40 billion. Gilead Sciences had a net margin of 14.03% and a return on equity of 45.49%. The business’s revenue for the quarter was down 21.8% on a year-over-year basis. During the same quarter in the prior year, the company earned $2.23 earnings per share. analysts anticipate that Gilead Sciences, Inc. will post 5.75 EPS for the current fiscal year.

The business also recently declared a quarterly dividend, which will be paid on Thursday, June 28th. Shareholders of record on Friday, June 15th will be paid a $0.57 dividend. The ex-dividend date of this dividend is Thursday, June 14th. This represents a $2.28 annualized dividend and a yield of 3.30%. Gilead Sciences’s dividend payout ratio is currently 26.64%.

Gilead Sciences Profile

Institutional Ownership by Quarter for Gilead Sciences (NASDAQ:GILD)

Tuesday, June 19, 2018

Market Correlations Like 2016 Suggest Dominoes Are Lining Up to Fall

LISTEN TO ARTICLE 2:09 SHARE THIS ARTICLE Facebook Twitter LinkedIn Email

While on-again, off-again risk aversion is the mantra for global markets in this age of trade spats, here’s a sign that the latest flight to safety may endure beyond Donald Trump’s next tweet.

A Morgan Stanley index that tracks correlation among regions and asset classes has reached its highest level since December 2016, a possible signal that the market’s defensive positioning could prove more lasting, according to a note from Tim Emmott, executive director at Olivetree Financial Ltd. 

#lazy-img-328682214:before{padding-top:56.25%;}

“The fact that this index is trending higher currently could well be the true signal for market players to realize that current multi-asset moves toward risk aversion may be more than short-term,” according to the note.

So far this year, flights to safety have occurred in short-lived bouts spurred, for instance, by the latest twists in trade tensions, without much of a domino effect across asset classes. The VIX Index still sits at its five-year average, while Treasury and currency volatility measures are far below their norms. It’s allowed investors to concentrate on asset- and company-specific drivers, keeping correlations low.

That may change as anxiety creeps back into the market. Emmott points to discussions about policy error that have emerged in the wake of the latest Federal Reserve meeting, the continued difficulty the ECB faces in raising interest rates thanks to macro and political developments and negative data out of China as rendering “the global inflation trade questionable at least.”

That’s spurred selloffs in emerging-market currencies and commodities that could spread to other asset classes should correlations remain elevated, he said in an interview.

It could also put an end to a stellar year for certain strategies. Macro hedge funds -- which bet on economic and political shifts -- lead all fund types in performance year-to-date, according to data from Credit Suisse Group AG. It’s a feat they haven’t accomplished since 2011, and they owe it to divergences between asset classes and regions, according to strategists at the Swiss bank.

“Taking the Morgan Stanley Global Correlation Index as a proxy, it would appear that the trade is breaking down,” Emmott wrote. “The move in correlation here may be the canary in the coalmine for the medium-term trajectory of real systemic risk to markets.”

Saturday, May 26, 2018

To beat the market, Bank of America outlines these tips for investors

There are several ways fund managers and investors can outperform the benchmark stock indexes, according to Bank of America Merrill Lynch.

So far this year, 60 percent of active fund managers are beating their respective market indexes, tracking to the best performance since 2003. But it hasn't always been this easy, particularly with the rush of investor money to so-called passive funds that track indexes.

"One of the biggest challenges for active managers has been a substantial shift to passive investment strategies," Bank of America equity and quantitative strategist Savita Subramanian said in a note to clients on Friday. "The best way to slow or reverse this shift is by generating alpha," another word for outperformance.

Bank of America made a list of seven says to beat the benchmark, three of which are highlighted here. "The job of an active fund manager is far from simple, and we would be remiss to reduce the complexity of fund management to a series of rules. But our quantitative work reveals a few techniques worth considering to beat the benchmark."

Here are some recommendations that investors can use to outperform.

1. "Pick your battles."

In some sectors, picking the right stock is key. For other sectors that are more influenced by macroeconomic factors, picking the sector is enough. Subramanian noted investors should focus on parts of the market with more return volatility, which provides opportunities for bigger gains.

She recommended technology, health care and consumer sectors as a "stock-picker's paradise." And for those betting on sectors, she recommended financials, real estate, utilities and energy "where being right on macro (rates, oil, GDP, etc.) is likely a more important call."

2. "Take the road less traveled��especially by the sell side."

Investors are more likely to find bargains in areas of the market that are less covered by Wall Street analysts, Subramanian said. Less research means these stocks could get overlooked, and they won't be prone to overcrowded trades by investors chasing hot stocks.

"The more eyeballs on a stock, the less alpha you're likely to harvest," she said. "Another pitfall avoided by steering clear of the sell-side darlings is crowding. Since the crisis, crowding has been a particularly acute issue for investors. In three of the last five years, the most overweighted stocks by active managers have underperformed the most underweighted stocks."

3. "Extend your time horizon."

Subramanian said short-term trading hurts returns because of higher levels of competition.

"Alpha over short time horizons has become increasingly hard to come by," she said. "But with the paucity of resources, investment strategies and eyeballs focused on the longer-term outlooks, the alpha opportunity over a longer time horizon has dramatically increased."

Bank of America Merrill Lynch research showed funds do better if they hold their positions for longer, three-year holding periods.

Friday, May 25, 2018

Standard General L.P. Buys Turning Point Brands Inc

New York, NY, based Investment company Standard General L.P. buys Turning Point Brands Inc during the 3-months ended 2018-03-31, according to the most recent filings of the investment company, Standard General L.P.. As of 2018-03-31, Standard General L.P. owns 4 stocks with a total value of $89 million. These are the details of the buys and sells.

Added Positions: NCMI, TPB,

For the details of Standard General L.P.'s stock buys and sells, go to http://www.gurufocus.com/StockBuy.php?GuruName=Standard+General+L.P.

These are the top 5 holdings of Standard General L.P.National CineMedia Inc (NCMI) - 14,387,113 shares, 83.65% of the total portfolio. Shares added by 8.59%Turning Point Brands Inc (TPB) - 455,319 shares, 9.92% of the total portfolio. Shares added by 49.13%CafePress Inc (PRSS) - 2,500,000 shares, 3.77% of the total portfolio. Emmis Communications Corp (EMMS) - 515,231 shares, 2.66% of the total portfolio. Added: Turning Point Brands Inc (TPB)

Standard General L.P. added to a holding in Turning Point Brands Inc by 49.13%. The purchase prices were between $19.44 and $22.38, with an estimated average price of $21.12. The stock is now traded at around $25.96. The impact to a portfolio due to this purchase was 3.27%. The holding were 455,319 shares as of 2018-03-31.


Here is the complete portfolio of Standard General L.P.. Also check out:

1. Standard General L.P.'s Undervalued Stocks
2. Standard General L.P.'s Top Growth Companies, and
3. Standard General L.P.'s High Yield stocks
4. Stocks that Standard General L.P. keeps buying

Thursday, May 24, 2018

Prudential Financial Inc. Buys 256,526 Shares of CIT Group (CIT)

Prudential Financial Inc. grew its stake in CIT Group (NYSE:CIT) by 496.6% during the first quarter, HoldingsChannel.com reports. The firm owned 308,179 shares of the financial services provider’s stock after purchasing an additional 256,526 shares during the quarter. Prudential Financial Inc.’s holdings in CIT Group were worth $15,871,000 as of its most recent filing with the Securities and Exchange Commission.

Several other large investors also recently added to or reduced their stakes in CIT. Renaissance Technologies LLC acquired a new position in shares of CIT Group in the fourth quarter valued at approximately $20,987,000. Assenagon Asset Management S.A. acquired a new position in shares of CIT Group in the fourth quarter valued at approximately $18,735,000. PGGM Investments acquired a new position in shares of CIT Group in the fourth quarter valued at approximately $15,778,000. Mackay Shields LLC acquired a new position in shares of CIT Group in the first quarter valued at approximately $10,372,000. Finally, Amundi Pioneer Asset Management Inc. acquired a new position in shares of CIT Group in the fourth quarter valued at approximately $8,641,000. 99.65% of the stock is currently owned by institutional investors and hedge funds.

Get CIT Group alerts:

Shares of CIT Group opened at $55.33 on Wednesday, MarketBeat Ratings reports. CIT Group has a 1-year low of $43.25 and a 1-year high of $56.14. The firm has a market cap of $7.03 billion, a P/E ratio of 18.02, a price-to-earnings-growth ratio of 1.35 and a beta of 1.30. The company has a current ratio of 1.09, a quick ratio of 1.09 and a debt-to-equity ratio of 1.53.

CIT Group (NYSE:CIT) last announced its quarterly earnings data on Tuesday, April 24th. The financial services provider reported $0.74 earnings per share for the quarter, missing the Zacks’ consensus estimate of $0.96 by ($0.22). CIT Group had a return on equity of 7.76% and a net margin of 11.93%. The business had revenue of $495.00 million for the quarter, compared to analyst estimates of $481.00 million. During the same period in the prior year, the company earned $0.54 EPS. equities analysts predict that CIT Group will post 4.1 EPS for the current fiscal year.

The firm also recently disclosed a quarterly dividend, which will be paid on Friday, May 25th. Investors of record on Friday, May 11th will be issued a dividend of $0.16 per share. This represents a $0.64 dividend on an annualized basis and a yield of 1.16%. The ex-dividend date is Thursday, May 10th. CIT Group’s dividend payout ratio is presently 20.85%.

A number of research analysts have recently issued reports on the company. Zacks Investment Research lowered CIT Group from a “buy” rating to a “hold” rating in a report on Tuesday, March 6th. TheStreet raised CIT Group from a “c+” rating to a “b-” rating in a report on Tuesday, March 20th. BMO Capital Markets dropped their target price on CIT Group from $49.00 to $46.00 and set a “market perform” rating on the stock in a report on Wednesday, April 25th. Credit Suisse Group boosted their target price on CIT Group from $50.00 to $54.00 and gave the company a “neutral” rating in a report on Monday, February 5th. Finally, Morgan Stanley boosted their target price on CIT Group from $54.00 to $57.00 and gave the company an “equal weight” rating in a report on Monday, February 5th. One investment analyst has rated the stock with a sell rating, nine have issued a hold rating and six have given a buy rating to the stock. The company currently has an average rating of “Hold” and a consensus price target of $54.83.

In related news, insider James L. Hudak sold 2,000 shares of the company’s stock in a transaction on Thursday, March 1st. The stock was sold at an average price of $53.63, for a total transaction of $107,260.00. The sale was disclosed in a document filed with the SEC, which is available at this link. Corporate insiders own 0.27% of the company’s stock.

CIT Group Company Profile

CIT Group Inc operates as the bank holding company for CIT Bank, National Association that provides banking and related services to commercial and individual customers. The company operates through three segments: Commercial Banking, Consumer Banking, and Non-Strategic Portfolios (NSP). The Commercial Banking segment offers lending, leasing, and other financial and advisory services primarily to small and middle-market companies; factoring, receivables management products, and secured supply chain financing; and equipment leasing and secured financing to railroads and non-rail companies.

Want to see what other hedge funds are holding CIT? Visit HoldingsChannel.com to get the latest 13F filings and insider trades for CIT Group (NYSE:CIT).

Institutional Ownership by Quarter for CIT Group (NYSE:CIT)

Wednesday, May 23, 2018

Should TJX Be Seeing a Bigger Boost From Earnings?

TJX Companies Inc. (NYSE: TJX) reported its fiscal first-quarter financial results before the markets opened on Tuesday. The retailer said that it had $1.13 in earnings per share (EPS) on $8.69 billion in revenue, compared with consensus estimates of $1.02 in EPS and revenue $8.47 billion. The same period of last year reportedly had EPS of $0.82 and $7.78 billion in revenue.

During the quarter, the company reported a comparable store sales increase of 3%, compared to 1% in the same period of last year. International comparable sales were up 1%.

In terms of its segments, the company reported as follows:

Marmaxx net sales increased 8% year over year to $5.38 billion. HomeGoods net sales rose 13% year over year to $1.27 billion. TJX Canada net sales increased 15% year over year to $853.8 million. TJX International net sales increased about 24% year over year to $1.18 billion.

Looking ahead, the company expects to see EPS to be in the range of $1.02 to $1.04 in the fiscal second quarter and $4.75 to $4.83 for the fiscal full year. The consensus estimates call for $1.10 in EPS for the second quarter and $4.85 for the full year.

On the books, TJX cash and cash equivalents totaled $2.68 billion at the end of the quarter, compared with $2.67 billion in the same period of last year.

Ernie Herrman, CEO and�president of TJX, commented:

We are very pleased with our first quarter results as both our consolidated comp store sales growth of 3% and earnings per share exceeded our expectations… Customer traffic was once again the primary driver of our comparable store sales increases at each of our four large divisions. Based on our strong first quarter performance, we are updating our outlook for full-year earnings per share. We believe that the consistency of our customer traffic increases demonstrates the strength and resiliency of our business and our ability to succeed through many types of economic and retail environments. Looking ahead, the second quarter is off to a strong start and we see plentiful opportunities to capitalize on the exciting fashions and brands available to us in the marketplace.

Shares of TJX were last seen up about 1.5% at $85.98, with a consensus analyst price target of $91.95 and a 52-week trading range of $66.44 to $87.31.

ALSO READ: 4 Red-Hot Mega-Retailers Ready for a Big Summer Selling Season