The industrials sector is home to many particularly solid and profitable corporations with strong competitive advantages. On the other hand, the sector is also quite cyclical and challenging, so it��s particularly important to pick the right names when investing in the industrials sector.
There's no infallible formula to picking winning stocks, but the statistical evidence indicates that companies with big cash distributions tend to deliver above-average returns over the long term, and this makes perfect sense from a fundamental investing point of view. With this in mind, the following article will be introducing a quantitative system to pick industrials stocks based on their capital distributions via dividends, buybacks, and debt cancellations.
On Dividends And BeyondWhen talking about cash distributions, most people tend to think first and foremost about dividends, which are arguably the most transparent and straightforward way to return capital to investors. On the other hand, shareholder yield can be a more holistic approach to cash distributions. In a nutshell, shareholder yield is a cash distribution metric that includes not only dividends, but also share buybacks and debt cancellations.
The convenience of buybacks over dividends ultimately depends on the particular case. If the stock is undervalued and business prospects are good, then buybacks can create a lot of value for shareholders, because the company is investing its capital in an undervalued asset, meaning its own stock. On the other hand, when the business is deteriorating or the stock is excessively priced, then buybacks have a negative impact on shareholder value.
By including debt paydowns in the equation, shareholder yield avoids situations in which companies finance their dividends and buybacks with borrowed money. Opportunistically issuing debt to finance cash distributions is not necessarily a bad thing, and it can even be a smart move under the right conditions. Nevertheless, money coming from internally generated funds as opposed to debt is a more sustainable and genuine source of capital distributions over the long term.
Importantly, these different venues of cash distributions are intimately related. Many companies tend to first cancel their debt when they have excess cash flow, then repurchase stock, and ultimately allocate those excess cash flows to dividend payments as the business matures over time. This means that companies making big debt cancellations and share buybacks today are many times the big dividend payers of tomorrow.
The main point is that cash distributions through multiple venues say a lot about a company and its financial strength, and shareholder yield can offer a big-picture perspective on cash distributions that is more comprehensive than dividends alone.
Besides, it��s one thing to say that a company looks undervalued in comparison to earnings and similar accounting metrics, since this can sometimes seem like an ephemeral concept to many investors. On the other hand, when the stock is cheap in comparison to cold-hard cash distributions, then undervaluation becomes a far more tangible idea.
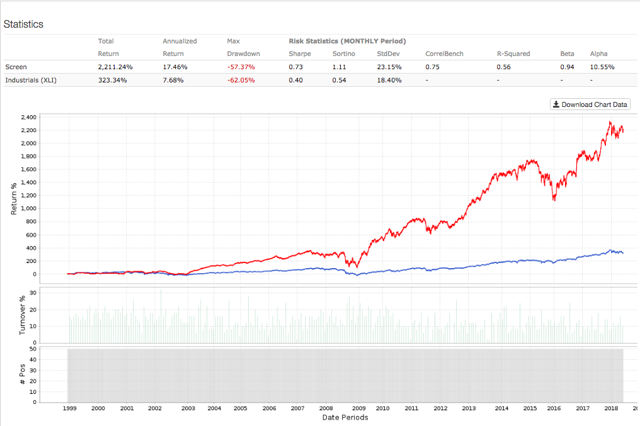
Backtested Performance And Recommended PortfolioThe following backtest considers only companies in the industrials sector and it excludes over the counter stocks to guarantee a minimum size and liquidity level. The system then picks the 50 stocks with the highest shareholder yield in that universe and builds an equally weighted portfolio with those names. The portfolio is rebalanced every four weeks and it has an assumed annual expense ratio of 1% to account for trading commissions. The benchmark is the Industrial Select Sector SPDR ETF (XLI).
 Data from S&P Global via Portfolio123
Backtested performance numbers are remarkable. Since January of 1999 the system gained 17.46% per year, far surpassing the 7.68% per year generated by the Industrial Select Sector SPDR ETF in the same period. In other words, a $100,000 investment in the sector-tracking ETF in January of 1999 would currently be worth around $423,300, and the same amount of capital allocated to the quantitative system would have an exponentially larger value of over $2.3 million.
The table below shows the 50 stocks selected by the system, data also includes market capitalization in million dollars and shareholder yield over the past 12 months.
Name | MktCap | S. Yield |
Boeing (BA) | $195,504 | 7% |
Union Pacific (UNP) | $110,516 | 6% |
CSX Corp. (CSX) | $56,898 | 6% |
Delta Air Lines (DAL) | $34,829 | 7% |
Eaton Corp. (ETN) | $33,244 | 6% |
Southwest Airlines (LUV) | $30,579 | 6% |
Ingersoll-Rand (IR) | $22,288 | 6% |
Cummins (CMI) | $21,589 | 6% |
United Continental (UAL) | $19,827 | 10% |
TransDigm Group (TDG) | $18,219 | 7% |
American Airlines Group (AAL) | $17,803 | 10% |
Spirit AeroSystems Holdings (SPR) | $9,653 | 6% |
HD Supply Holdings (HDS) | $7,974 | 8% |
Fortune Brands Home & Security (FBHS) | $7,960 | 7% |
Carlisle Companies (CSL) | $6,823 | 7% |
JetBlue Airways (JBLU) | $6,146 | 6% |
Allison Transmission Holdings (ALSN) | $5,555 | 12% |
Graftech International (EAF) | $5,549 | 20% |
Macquarie Infrastructure (MIC) | $3,720 | 11% |
Terex Corp. (TEX) | $3,247 | 28% |
GATX Corp. (GATX) | $2,839 | 6% |
Avis Budget Group (CAR) | $2,706 | 6% |
Allegiant Travel (ALGT) | $2,326 | 6% |
Covanta Holding (CVA) | $2,220 | 6% |
Masonite International (DOOR) | $2,016 | 7% |
Hawaiian Holdings (HA) | $1,846 | 7% |
Pitney Bowes (PBI) | $1,705 | 8% |
Aircastle (AYR) | $1,607 | 6% |
Interface (TILE) | $1,425 | 6% |
NCI Building Systems (NCS) | $1,406 | 6% |
Quad/Graphics (QUAD) | $1,149 | 6% |
Wabash National (WNC) | $1,129 | 7% |
Atkore International Group (ATKR) | $984 | 34% |
Griffon Corp. (GFF) | $842 | 6% |
Avianca Holdings SA (AVH) | $820 | 8% |
Blue Bird Corp. (BLBD) | $545 | 6% |
LSC Communications (LKSD) | $483 | 7% |
CRA International (CRAI) | $447 | 7% |
R.R. Donnelley & Sons (RRD) | $407 | 10% |
Fly Leasing (FLY) | $391 | 14% |
Armstrong Flooring (AFI) | $374 | 9% |
Safe Bulkers (SB) | $349 | 11% |
Babcock & Wilcox Enterprises (BW) | $99 | 18% |
Limbach Holdings (LMB) | $89 | 16% |
Cypress Energy Partners LP (CELP) | $89 | 8% |
RCM Technologies (RCMT) | $60 | 20% |
Alpha Pro Tech (APT) | $48 | 8% |
L.S. Starrett (SCX) | $46 | 6% |
Globus Maritime (GLBS) | $17 | 87% |
Staffing 360 Solutions (STAF) | $6 | 31% |
Please keep in mind that only because a company has an elevated shareholder yield over the past year, that does not guarantee that such yield is sustainable going forward. Besides, cheap stocks are sometimes cheap for a good reason, so investors need to do their own homework and take a deep look at the company behind the numbers before making any buy or sell decisions based on metrics such as shareholder yield.
That acknowledged, there is plenty of statistical data proving that companies with elevated shareholder yield tend to deliver above-average returns, and my own backtesting work confirms that focusing on shareholder yield in the industrials sector can produce attractive returns over the long term. For this reason, a quantitative system such as this one can be a valuable tool to identify promising investing ideas for further research.
Capitalize on the power of data and technology to take the guesswork out of your investment decisions. Statistical research has proven that stocks and ETFs showing certain quantitative attributes tend to outperform the market over the long term. A subscription to The Data Driven Investor provides you access to profitable screeners and live portfolios based on these effective and time-proven return drivers. Forget about opinions and speculation, investing decisions based on cold-hard quantitative data can provide you superior returns with lower risk. Click here to get your free trial now.
Disclosure: I/we have no positions in any stocks mentioned, and no plans to initiate any positions within the next 72 hours.
I wrote this article myself, and it expresses my own opinions. I am not receiving compensation for it (other than from Seeking Alpha). I have no business relationship with any company whose stock is mentioned in this article.
Editor's Note: This article covers one or more stocks trading at less than $1 per share and/or with less than a $100 million market cap. Please be aware of the risks associated with these stocks.
No comments:
Post a Comment